It is the last week of the quarter. The donor report is due on Friday. The M&E team that had four people last year now has one, and she is still waiting for data from three field sites.
If that sounds familiar, you are not alone. Across Kenya, programme teams are being asked to show the same results, to the same standard, with far fewer people and far less money. Some organisations have lost their data officers. Others have lost the systems those officers used to run.
At Dataque Analytics, much of our work happens inside monitoring, evaluation and reporting systems, so we have watched this pressure build over the past year. This piece pulls together what the latest research tells us about the funding gap and, more usefully, what a smaller team can do about it starting this month.
What has actually changed
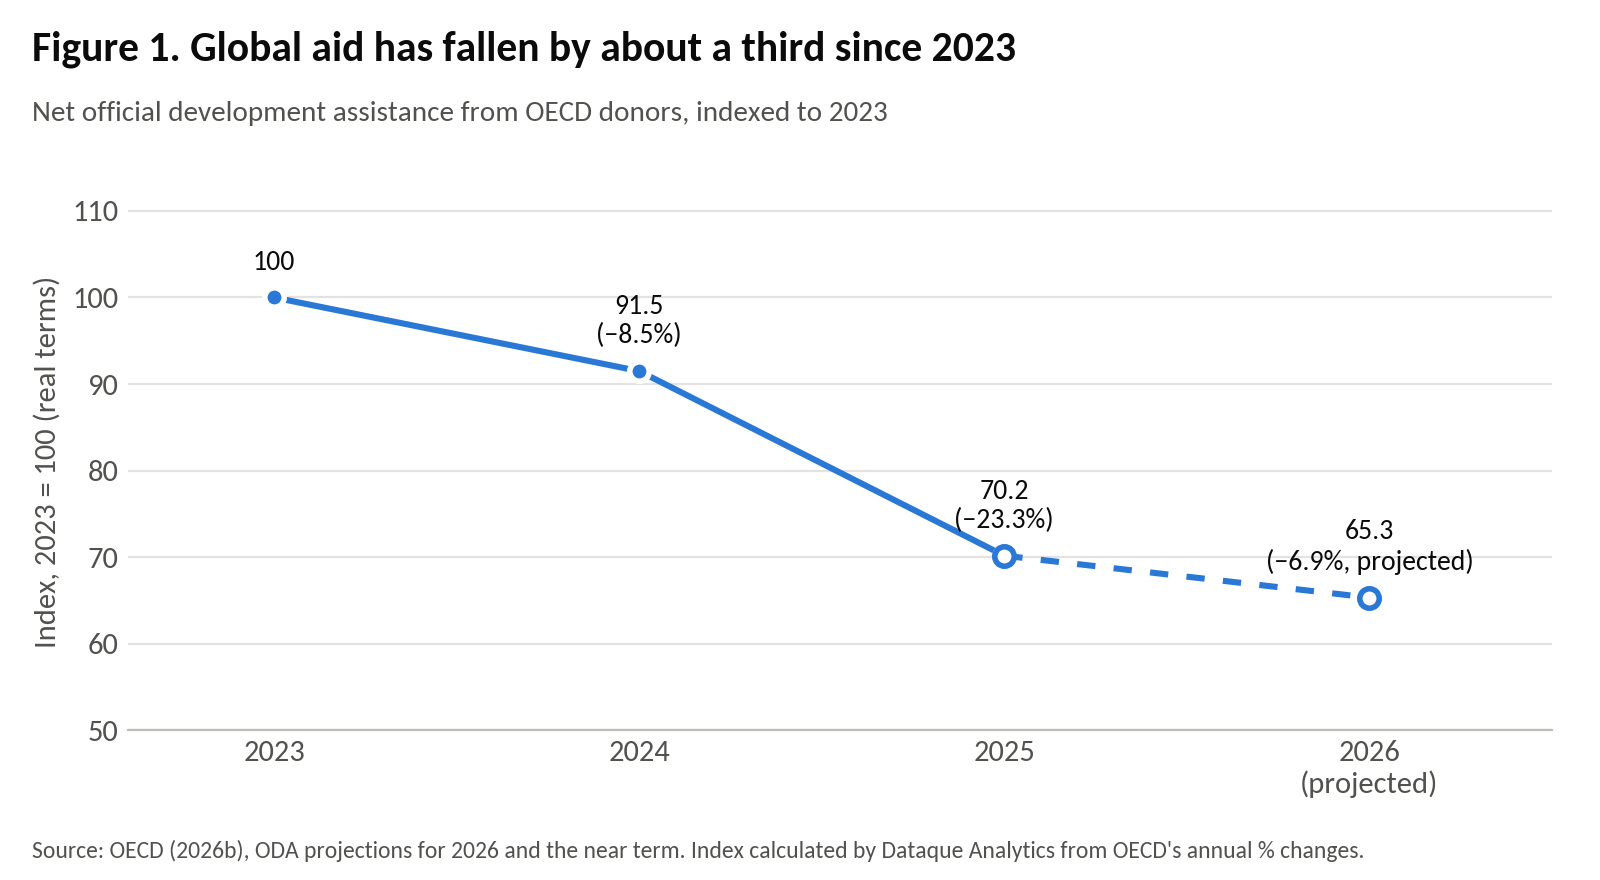
The numbers are hard to ignore. Official development assistance from OECD donors fell by 8.5% in 2024 and then by a record 23.3% in 2025, to about USD 174 billion (OECD, 2026a, 2026b). The OECD expects a further 6.9% fall in 2026, with bilateral aid to sub-Saharan Africa projected to drop by 11.6% (OECD, 2026b). Put together, global aid in 2026 is likely to be about a third lower than it was in 2023 (Figure 1).
 The United States drove most of this. Its cuts made up about three quarters of the 2025 decline (Global Donor Platform for Rural Development, 2026). After adjusting for inflation, US foreign aid disbursements fell from USD 73.5 billion in fiscal year 2024 to USD 47.3 billion in fiscal year 2025, the lowest level since 2004. In the first nine months of fiscal year 2026, only about USD 7 billion had been paid out (DeSilver, 2026).
Kenya: what the numbers show
Kenya has been one of the largest recipients of US aid in Africa. Between 2020 and 2025, USAID provided about USD 2.5 billion, roughly USD 470 million a year, and about 80% of it went to health (Physicians for Human Rights, 2025).
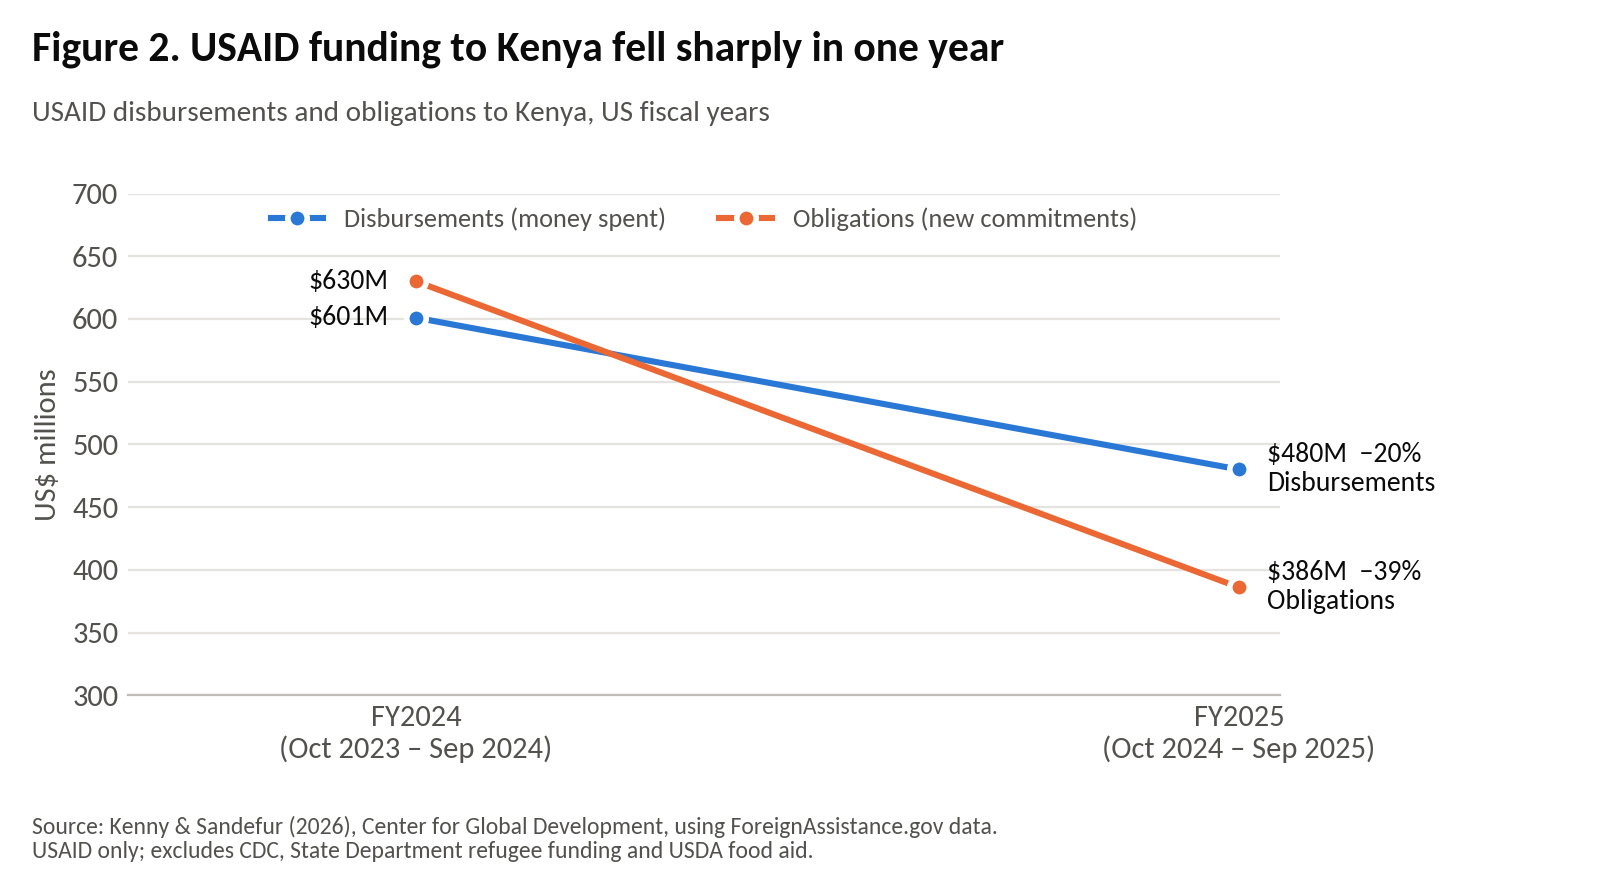
In a single year, USAID payments to Kenya fell by 20%, from USD 601 million to USD 480 million. New commitments fell even faster, by 39%, from USD 630 million to USD 386 million (Kenny & Sandefur, 2026; Figure 2). Commitments are the pipeline for next year’s programmes, so that second line tells us the squeeze on Kenyan programmes is still working its way through.
Which sectors were hit hardest
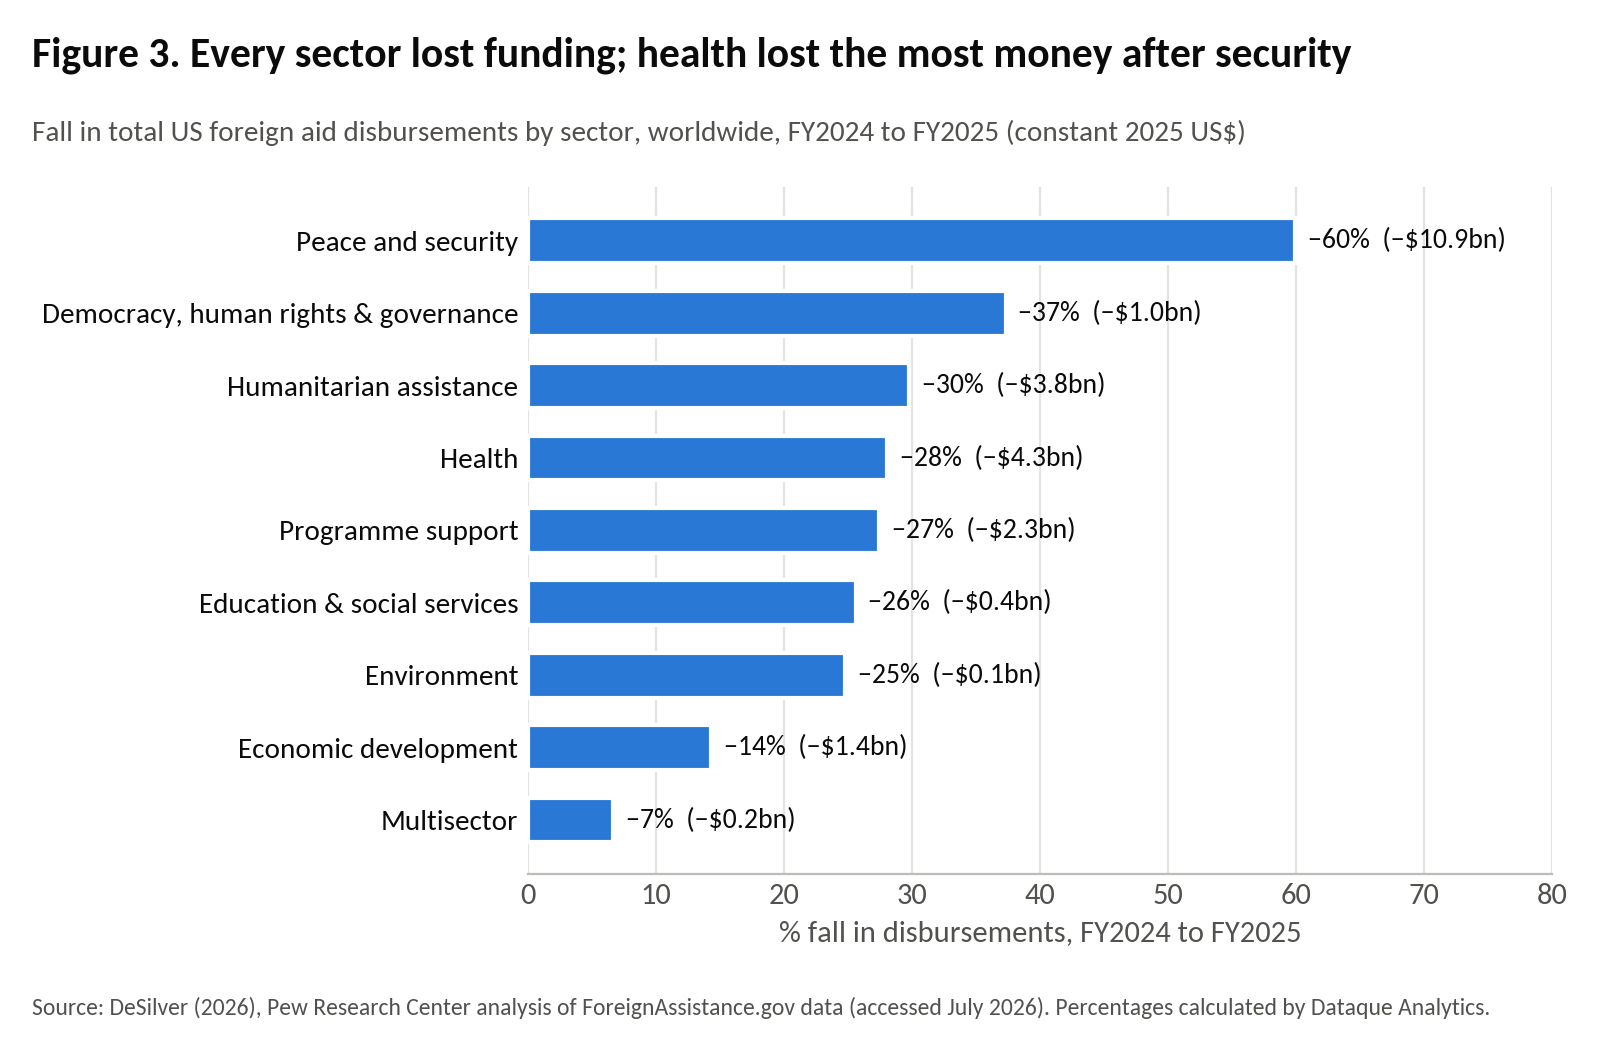
Every sector lost money (Figure 3). In percentage terms, peace and security (−60%) and democracy, human rights and governance (−37%) were cut the hardest. In cash terms, health lost more than any other development sector, about USD 4.3 billion in one year, followed by humanitarian assistance at USD 3.8 billion (DeSilver, 2026).
New USAID commitments show where the next round of pain will land. Between fiscal years 2024 and 2025, commitments fell by 85% for disaster readiness, 72% for civil society, 69% for agriculture, 67% for both good governance and water and sanitation, 56% for basic education and 45% for HIV/AIDS (Kenny & Sandefur, 2026). These are exactly the areas where many Kenyan NGOs, county programmes and their M&E teams work.
For Kenya, health and reproductive health were the most exposed. Before January 2025, the US government provided about a quarter of Kenya’s health funding and more than half of its population and reproductive health funding (Branoff et al., 2026). Table 1 sums up the exposure.
Table 1. How exposed Kenyan programmes were to US funding cuts
| Indicator | Value | Source |
|---|---|---|
| Share of Kenya’s health funding from the US government (before Jan 2025) | 26% | Branoff et al. (2026) |
| Share of population and reproductive health funding from the US government | 61% | Branoff et al. (2026) |
| Share of USAID programming in Kenya cut by March 2025 | 46% | Branoff et al. (2026) |
| Share of USAID funding to Kenya spent on health, 2020–2025 | ≈80% | Physicians for Human Rights (2025) |
| Health workers facing possible layoffs | ≈41,500 (18% of the workforce) | Physicians for Human Rights (2025) |
A note on the data: US figures follow the US fiscal year (October to September) and come from ForeignAssistance.gov, which is still being updated, so recent years may be revised. The Kenya figures in Figure 2 cover USAID only. A full sector-by-sector breakdown for Kenya alone has not yet been published, so Figure 3 shows US aid worldwide.
The data systems were hit too
For anyone who manages data, one example stands out. When the cuts were announced, KenyaEMR, the electronic medical records system, went offline. Although the government managed it, it was hosted on a server run by a USAID-funded implementer (Serebro, 2026). The data was there, but nobody could reach it.
Data collection itself has shrunk. The World Food Programme carried out about 800,000 interviews in 2025, down from 1.1 million the year before, and the number of its offices doing real-time monitoring fell from 35 to 18 (Bauer & Chia, 2026). Writing from the Center for Global Development, Kenny (2026) warns that we still do not have the outcome data needed to know the true human cost of these cuts.
Reporting has not gone away. It matters more.
It would be easy to assume that less money means lighter reporting. The opposite is happening. Under the Kenya–US health cooperation framework signed in December 2025, US support of up to USD 1.6 billion over five years will gradually decrease while Kenya raises its own health spending by USD 850 million (European AIDS Treatment Group, 2025). Kenya has also agreed to share aggregated programme and outcome data from its national digital health platforms (Maleche et al., 2026).
In other words, government, county and programme teams will be expected to produce reliable data on results, often with their own money and their own staff. The funders who remain are also choosing carefully where their money goes. The New Humanitarian describes the sector’s new reality as “doing less with less” (Loy & Worley, 2026). The organisations that can show clear, credible evidence will be the ones that keep their funding.
The real problem is where the hours go
When we map M&E workflows with clients, we see the same pattern again and again. Most of the team’s time does not go into analysis. It goes into chasing submissions, cleaning spreadsheets, copying figures from one file to another and formatting reports. Thinking about what the numbers mean gets squeezed into the last few hours before the deadline.
With a full team, that was inefficient. With a team of one or two, it is impossible. The answer is not longer working hours. It is removing the work that better design and simple automation can do, so the people you still have can focus on judgement and learning.
Here are six practical steps that make that possible.
1. Cut your indicator list down to the ones someone uses
Many logframes carry dozens of indicators, and some are collected simply because they always have been. Go through yours one by one and ask three questions: who uses this number, what decision does it inform, and how often is it needed? If nobody can answer, drop it or collect it less often.
This is the thinking behind “lean data”, an approach that favours data that is useful, light-touch and tied to real decisions over data collected for compliance alone (Dichter et al., 2016). Raise it with your donor early. In our experience, most programme officers would rather receive ten reliable indicators on time than forty shaky ones late.
2. Collect data on phones and check it at the point of entry
Paper forms that are later typed into Excel are slow, and they introduce mistakes. A randomised experiment with 1,840 households in Tanzania found that paper-based survey data contained many errors that tablet-based collection avoided. Worse, the errors were not random; they were linked to household characteristics, which can bias results (Caeyers et al., 2012).
The tools are no longer expensive. KoboToolbox, which is free for most humanitarian and development users, handled 291 million surveys in 2025 alone and now offers free training for nonprofits in the Global South (KoboToolbox, 2026). The real gain comes from building checks into the form itself: required fields, sensible ranges, skip logic and GPS capture. Errors are then caught in the field by the person who can fix them, not weeks later in the office.
3. Build the reporting pipeline once, then let it run
Once data arrives digitally, connect it to one central database and a dashboard that refreshes on its own. Tools many organisations already have, such as Power BI, Looker Studio or Google Sheets, are enough to start. Your monthly or quarterly report can then pull its tables and charts from that dashboard instead of being rebuilt by hand each time.
A simple rule helps here: no one should have to copy the same number by hand twice.
4. Use data that already exists, and cheaper ways to collect new data
Before you design a new survey, check what is already being collected. Government systems such as the Kenya Health Information System, county reports, KNBS statistics and partners’ data may answer part of your question. Agreeing to share data with partners working in the same area can also save each of you a full round of fieldwork.
When you do need new data, consider short phone surveys instead of field visits. In the lean data examples above, one organisation completed 650 short phone calls in four months using its existing staff (Dichter et al., 2016). Bauer and Chia (2026) also point to newer options, including AI-based forecasting, satellite data and shared data agreements between agencies, to fill gaps left by smaller surveys.
5. Let AI do the heavy reading, but keep a person in charge
Generative AI is useful for the text-heavy parts of M&E: summarising focus group transcripts, sorting open-ended survey answers into themes, and producing a first draft of a narrative report. Guidance from the World Bank’s Independent Evaluation Group confirms that large language models are good at classifying, summarising and extracting information from large volumes of text. It is equally clear that their output must be checked carefully before it is used (Raimondo et al., 2025).
Be careful with personal data. Kenya’s Data Protection Act applies to anything you paste into an AI tool (Data Protection Act, 2019). Remove names, phone numbers and ID numbers first, and use tools your organisation has approved rather than personal accounts.
6. Make sure you own your data systems
The KenyaEMR example is a warning for every programme. If your database, survey account or dashboard sits on a server or login that belongs to a partner whose grant can end, your records can disappear with that grant. Take an hour this month to confirm who holds the passwords, where your data is hosted and when it was last backed up. Write the answers down and keep them somewhere the whole team can find.
What this looks like in practice
Take a typical monthly report. Before: field teams send Excel files by email or WhatsApp, someone spends two or three days merging and cleaning them, the charts are built by hand, and the report is written in a rush at the end. After: field staff submit on their phones with checks built in, the data lands in one database overnight, the dashboard is already up to date, and the team spends its time on the question that actually matters: what is working, and what should change?
None of this needs a big IT budget. It needs a clear list of what you really have to report, and a willingness to stop doing things by hand that a simple system can do for you.
Where to start this month
-
- List every report your team produces, who reads it and roughly how many hours it takes.
-
- Pick the one report that takes the most time and map every step, from data collection to submission.
-
- Remove or reduce the indicators nobody uses, and agree the changes with your donor.
-
- Move that report’s data collection to a digital form with built-in checks.
-
- Confirm who owns your accounts, servers and backups, and write it down.
A smaller team can still tell a strong story
The aid cuts are real, and they are painful. But a smaller M&E team does not have to mean weaker evidence. When the routine work is automated and the indicator list is honest, one skilled person can deliver the kind of insight that used to take a whole department, because their time goes into thinking rather than typing.
At Dataque Analytics, we design and automate monitoring, evaluation and learning systems for programmes in Kenya and across the region. If you would like a second pair of eyes on your reporting workflow, get in touch with us. We would also like to hear from you: what is taking up most of your team’s time right now? Tell us in the comments.
References
Bauer, J.-M., & Chia, H. S. (2026, February 24). The coming humanitarian data drought. Center for Global Development. https://www.cgdev.org/blog/coming-humanitarian-data-drought
Branoff, S., Ngo, T. D., Engebretsen, S., Greene, M. C., Kosgei, J., Merlim, L., Ramirez, C., Shrestha, A., Tamang, A., Tamang, J., & Casey, S. E. (2026). Global health consequences of the 2025 US foreign aid freeze: Rapid assessments in Colombia, Kenya and Nepal. BMJ Public Health, 4(3), e004904. https://pmc.ncbi.nlm.nih.gov/articles/PMC13405021/
Caeyers, B., Chalmers, N., & De Weerdt, J. (2012). Improving consumption measurement and other survey data through CAPI: Evidence from a randomized experiment. Journal of Development Economics, 98(1), 19–33. https://doi.org/10.1016/j.jdeveco.2011.12.001
Data Protection Act, No. 24 of 2019. (2019). Kenya Law. https://www.kenyalaw.org/kl/fileadmin/pdfdownloads/Acts/2019/TheDataProtectionAct__No24of2019.pdf
DeSilver, D. (2026, July 21). U.S. foreign aid is plunging in second Trump administration. Pew Research Center. https://www.pewresearch.org/short-reads/2026/07/21/us-foreign-aid-is-plunging-in-second-trump-administration/
Dichter, S., Adams, T., & Ebrahim, A. (2016). The power of lean data. Stanford Social Innovation Review. https://ssir.org/articles/entry/the_power_of_lean_data
European AIDS Treatment Group. (2025, December). United States and Kenya sign five-year, $2.5 billion health cooperation framework. https://www.eatg.org/hiv-news/united-states-and-kenya-sign-five-year-2-5-billion-health-cooperation-framework/
Global Donor Platform for Rural Development. (2026). OECD: Preliminary 2025 ODA data. https://www.donorplatform.org/post/oecd-preliminary-2025-oda-data/
Kenny, C. (2026, September 30). We don’t know the impact of humanitarian aid cuts. We should fix that. Center for Global Development. https://www.cgdev.org/blog/we-dont-know-impact-humanitarian-aid-cuts-we-should-fix
Kenny, C., & Sandefur, J. (2026, April 23). USAID spending at the country and sector level: What happened in fiscal year 2025? Center for Global Development. https://www.cgdev.org/blog/usaid-spending-country-and-sector-level-what-happened-fiscal-2025
KoboToolbox. (2026, February 5). Kobo’s 2025 highlights: 1 billion surveys and a decade of community-led impact. https://www.kobotoolbox.org/blog/kobo-2025-highlights-1-billion-surveys-and-a-decade-of-community-led-impact
Loy, I., & Worley, W. (2026, January 7). 2026 humanitarian aid policy trends: Shrinking funds, weird partnerships, AI drones and influencers, aid worker threats. The New Humanitarian. https://www.thenewhumanitarian.org/analysis/2026/01/07/whats-shaping-aid-policy-2026
Maleche, A., Sekalala, S., & Wafula, T. (2026). Health data protection and governance under the Kenya–US health agreement. Health and Human Rights, 28(1). https://pmc.ncbi.nlm.nih.gov/articles/PMC13334705/
OECD. (2026a, April). International aid fell sharply in 2025, says OECD [Press release]. https://www.oecd.org/en/about/news/press-releases/2026/04/international-aid-fell-sharply-in-2025-says-oecd.html
OECD. (2026b). ODA projections for 2026 and the near term. OECD Publishing. https://www.oecd.org/en/publications/oda-projections-for-2026-and-the-near-term_d7c74fa2-en/full-report.html
Physicians for Human Rights. (2025, July 24). “The system is folding in on itself”: The impact of U.S. global health funding cuts in Kenya. https://phr.org/our-work/resources/the-system-is-folding-in-on-itself-the-impact-of-u-s-global-health-funding-cuts-in-kenya/
Raimondo, E., Den Boer, H., & Anuj, H. (2025, May 19). Balancing innovation and rigor: Guidance on how to thoughtfully integrate AI in evaluation. Independent Evaluation Group, World Bank Group. https://ieg.worldbankgroup.org/blog/balancing-innovation-and-rigor-guidance-how-thoughtfully-integrate-ai-evaluation
Serebro, D. (2026, January 20). African leadership amid disruptions to US aid. ODI. https://odi.org/en/insights/african-leadership-amid-disruptions-to-us-aid/